During the year we’ll be keeping an eye on the www.police.uk website for figures on crime and anti-social behaviour in our local areas.
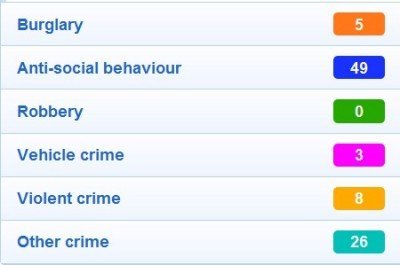
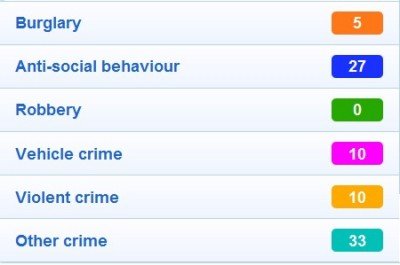
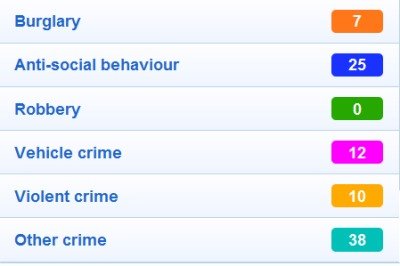
These figures have only been published so far for last December, January and February, so it’s too soon to really look for any trends, but here are the figures so far for Rayleigh:
December 2010:
January 2011:
February 2011:
So you can see that there’s been fewer reports of anti-social behaviour since the New Year.
And for a town of around 15,000 homes, the chances of being burgled are pretty low – especially if you take precautions.
Incidentally the www.police.uk website seems to have separate data for just about every village and town in the district, from Rawreth in the west to Foulness Island in the east (though the figures for Foulness are all zeroes so far!)


Could you please clarify what is meant by violent crime Some of the incidents listed previously under this category have not been very serious It can create the impression thst Rayleigh is a more dangerous place than it really is.
It’s a good point you make Bruce. The website isn’t very clear on what “violent crime” means – it merely says:
‘includes crimes against the person such as common assault, harrassment and grievous bodily harm’
To put the figures into perspective, if each of these has only one victim, 10 per month in a town of 30,000 people means you are likely to be a victim of one of these crimes every 3,000 months or 250 years.