
The BBC reports today that Campaign To Protect Rural England has just produced a map showing the tranquil areas of England.
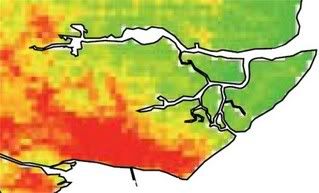
The green areas are the most peacful, the red areas the least so.
The CPRE say that the areas of tranquillity are shrinking and this loss is a big problem because “tranquillity is so important for so many reasons. It?s good for our mental and physical wellbeing, it improves our quality of life and it?s critical to rural economies.”
Anyway here’s a close-up of South East Essex. As you can see – large parts of our district – Foulness, Wallasea Island, Canewdon, Paglesham, and pockets of Hullbridge, Rochford and Rawreth are still tranquil. Let’s hope we can keep them that way.
THE CPRE explain their map as follows:
Our new map shows, in detail and across the whole of England, how likely the local surroundings are to make a visitor feel tranquil. The spectrum of colours ranges from deep red ? within towns and cities and along major roads ? shading through orange and yellow to a rich green in the most unspoilt areas of deep countryside with big views and little man-made noise.
Finding tranquillity in the countryside matters deeply to people: it contributes to mental and physical health and to quality of life.A new opinion poll commissioned by CPRE shows what people most enjoy and appreciate about the countryside is ?peace and quiet?. And most people, wherever they live, say rural tranquillity is very important to them ? and fear it is under threat.
What tranquillity is ? the top 10 survey responses:
Seeing a natural landscape
Hearing birdsong
Hearing peace and quiet
Seeing natural looking woodland
Seeing the stars at night
Seeing streams
Seeing the sea
Hearing natural sounds
Hearing wildlife
Hearing running waterhat tranquillity is not ? the top 10 survey responses
Hearing constant noise from cars, lorries and/or motorbikes
Seeing lots of people
Seeing urban development
Seeing overhead light pollution
Hearing lots of people
Seeing low flying aircraft
Hearing low flying aircraft
Seeing power lines
Seeing towns and cities
Seeing roadsThe tranquillity map is made up of many layers of information based on what people say adds to and detracts from tranquillity, weighted according to how important those factors are and taking into account the country?s topography. If you could peel away the layers, you would see maps which show the positive or negative impact on tranquillity of:
a natural landscape, including woodland
rivers, streams, lakes and the sea
birds and other wildlife
wide open spaces
cars, motorbikes, trains and aircraft? and roads and railways
light pollution
towns, cities and villages
large numbers of people
pylons, power lines, masts and wind turbines.
